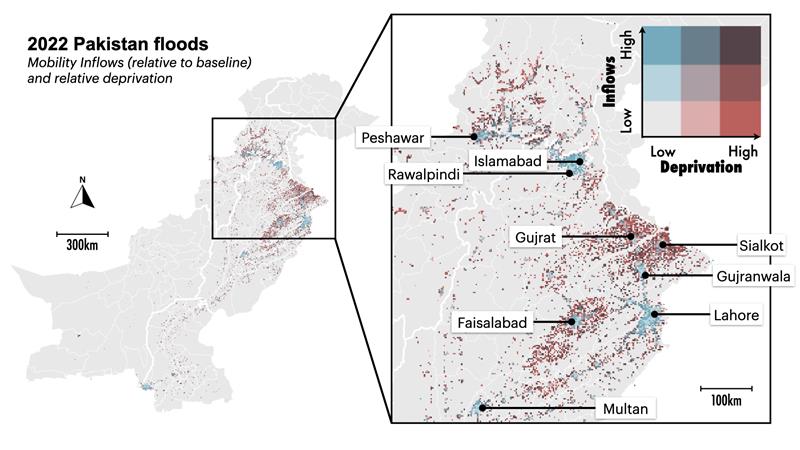
Fig 1. A bivariate map, showing the percentage change in the number of inflows and the relative deprivation index, at the tile level.
This product covers the analysis period xxxxx to xxxxxx 2022. There may be changes in information when new data is released.
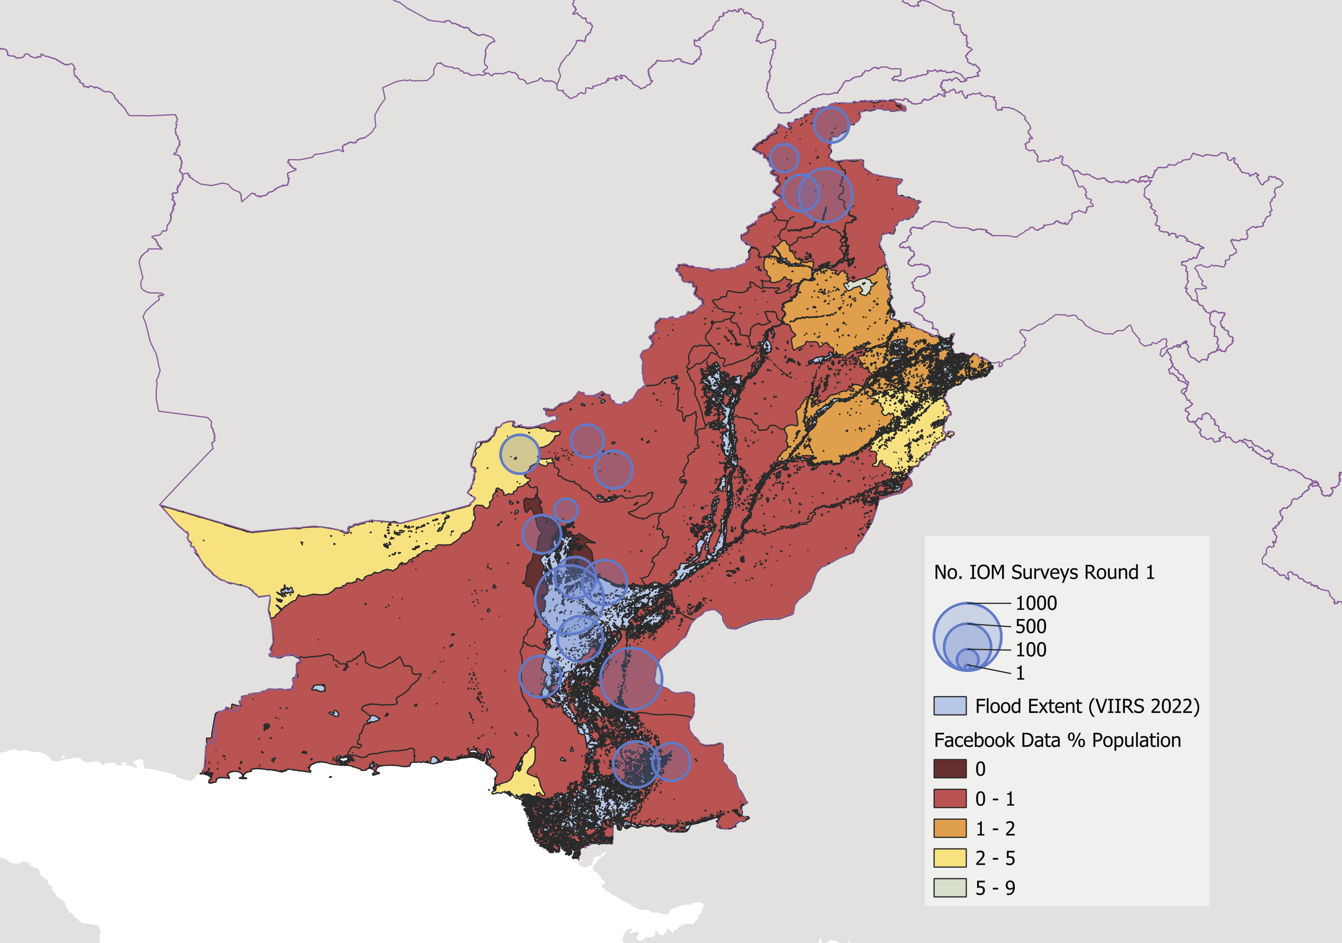
This product utilises data from Facebook population and movement data.
This data is representative of a subset of active facebook accounts in the area and is not representative of the entire population. Please see Figure 1 below and speak to your analyst for more information.
This product utilises data from IOM. This data has been rapidly collected via surveys and may not be representative of the entire population. Please see Figure 1 below and speak to your analyst for more information. …
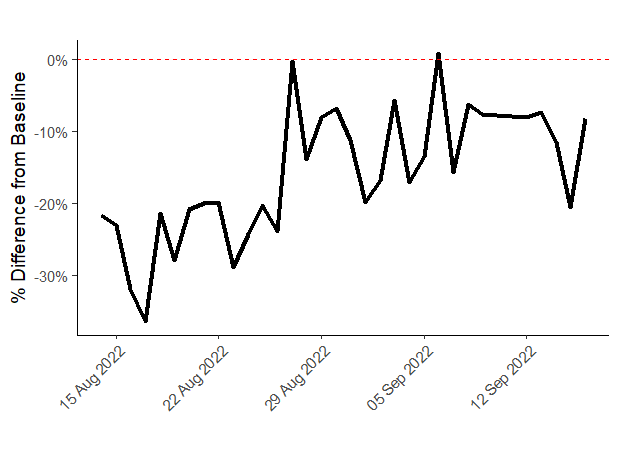
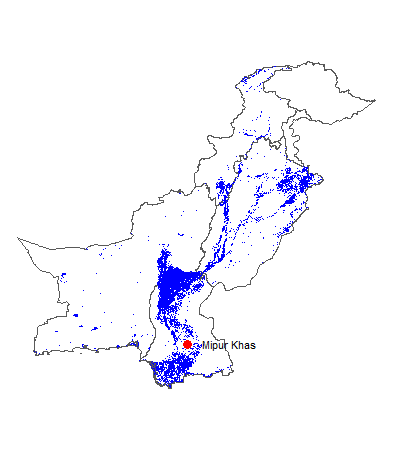
The data for flows is based on data from the 22nd of August 2022, the day when the largest number of movements was registered throughout the whole period. On the left, we see a map of the whole of Pakistan. This map illustrates where the data is located. It gives us a good idea of the coverage of our data. We did not include flows with less than 10 people.
On the right we see a zoomed in region of Pakistan: the North East, which is the area with the highest concentration of large cities. It is also the region with most data. We see that in urban cores there is a lot of inflows but low deprivation. However, in the rings surrounding these urban cores, we see problematic areas: high inflows and high deprivation. These areas are were resources would be most needed.
In many of the more rural areas on the outskirts of cities in the North of Pakistan, we observe high levels of deprivation combined with high levels of displacement - providing an initial indicator of areas in highest severity need
There is limited data availability of Facebook movements toward the south of Pakistan. Further analysis of these areas is recommended.
This map shows volumes of travel between administrative areas, where volumes above baseline are coloured in Red and volumes below baseline are coloured in Blue. The width of the arrows is broadly representative of volumes.
In the early days of the flooding events, we observe high levels of migration out of the Mirpur Khas area with the numbers of people entering this area below baseline.
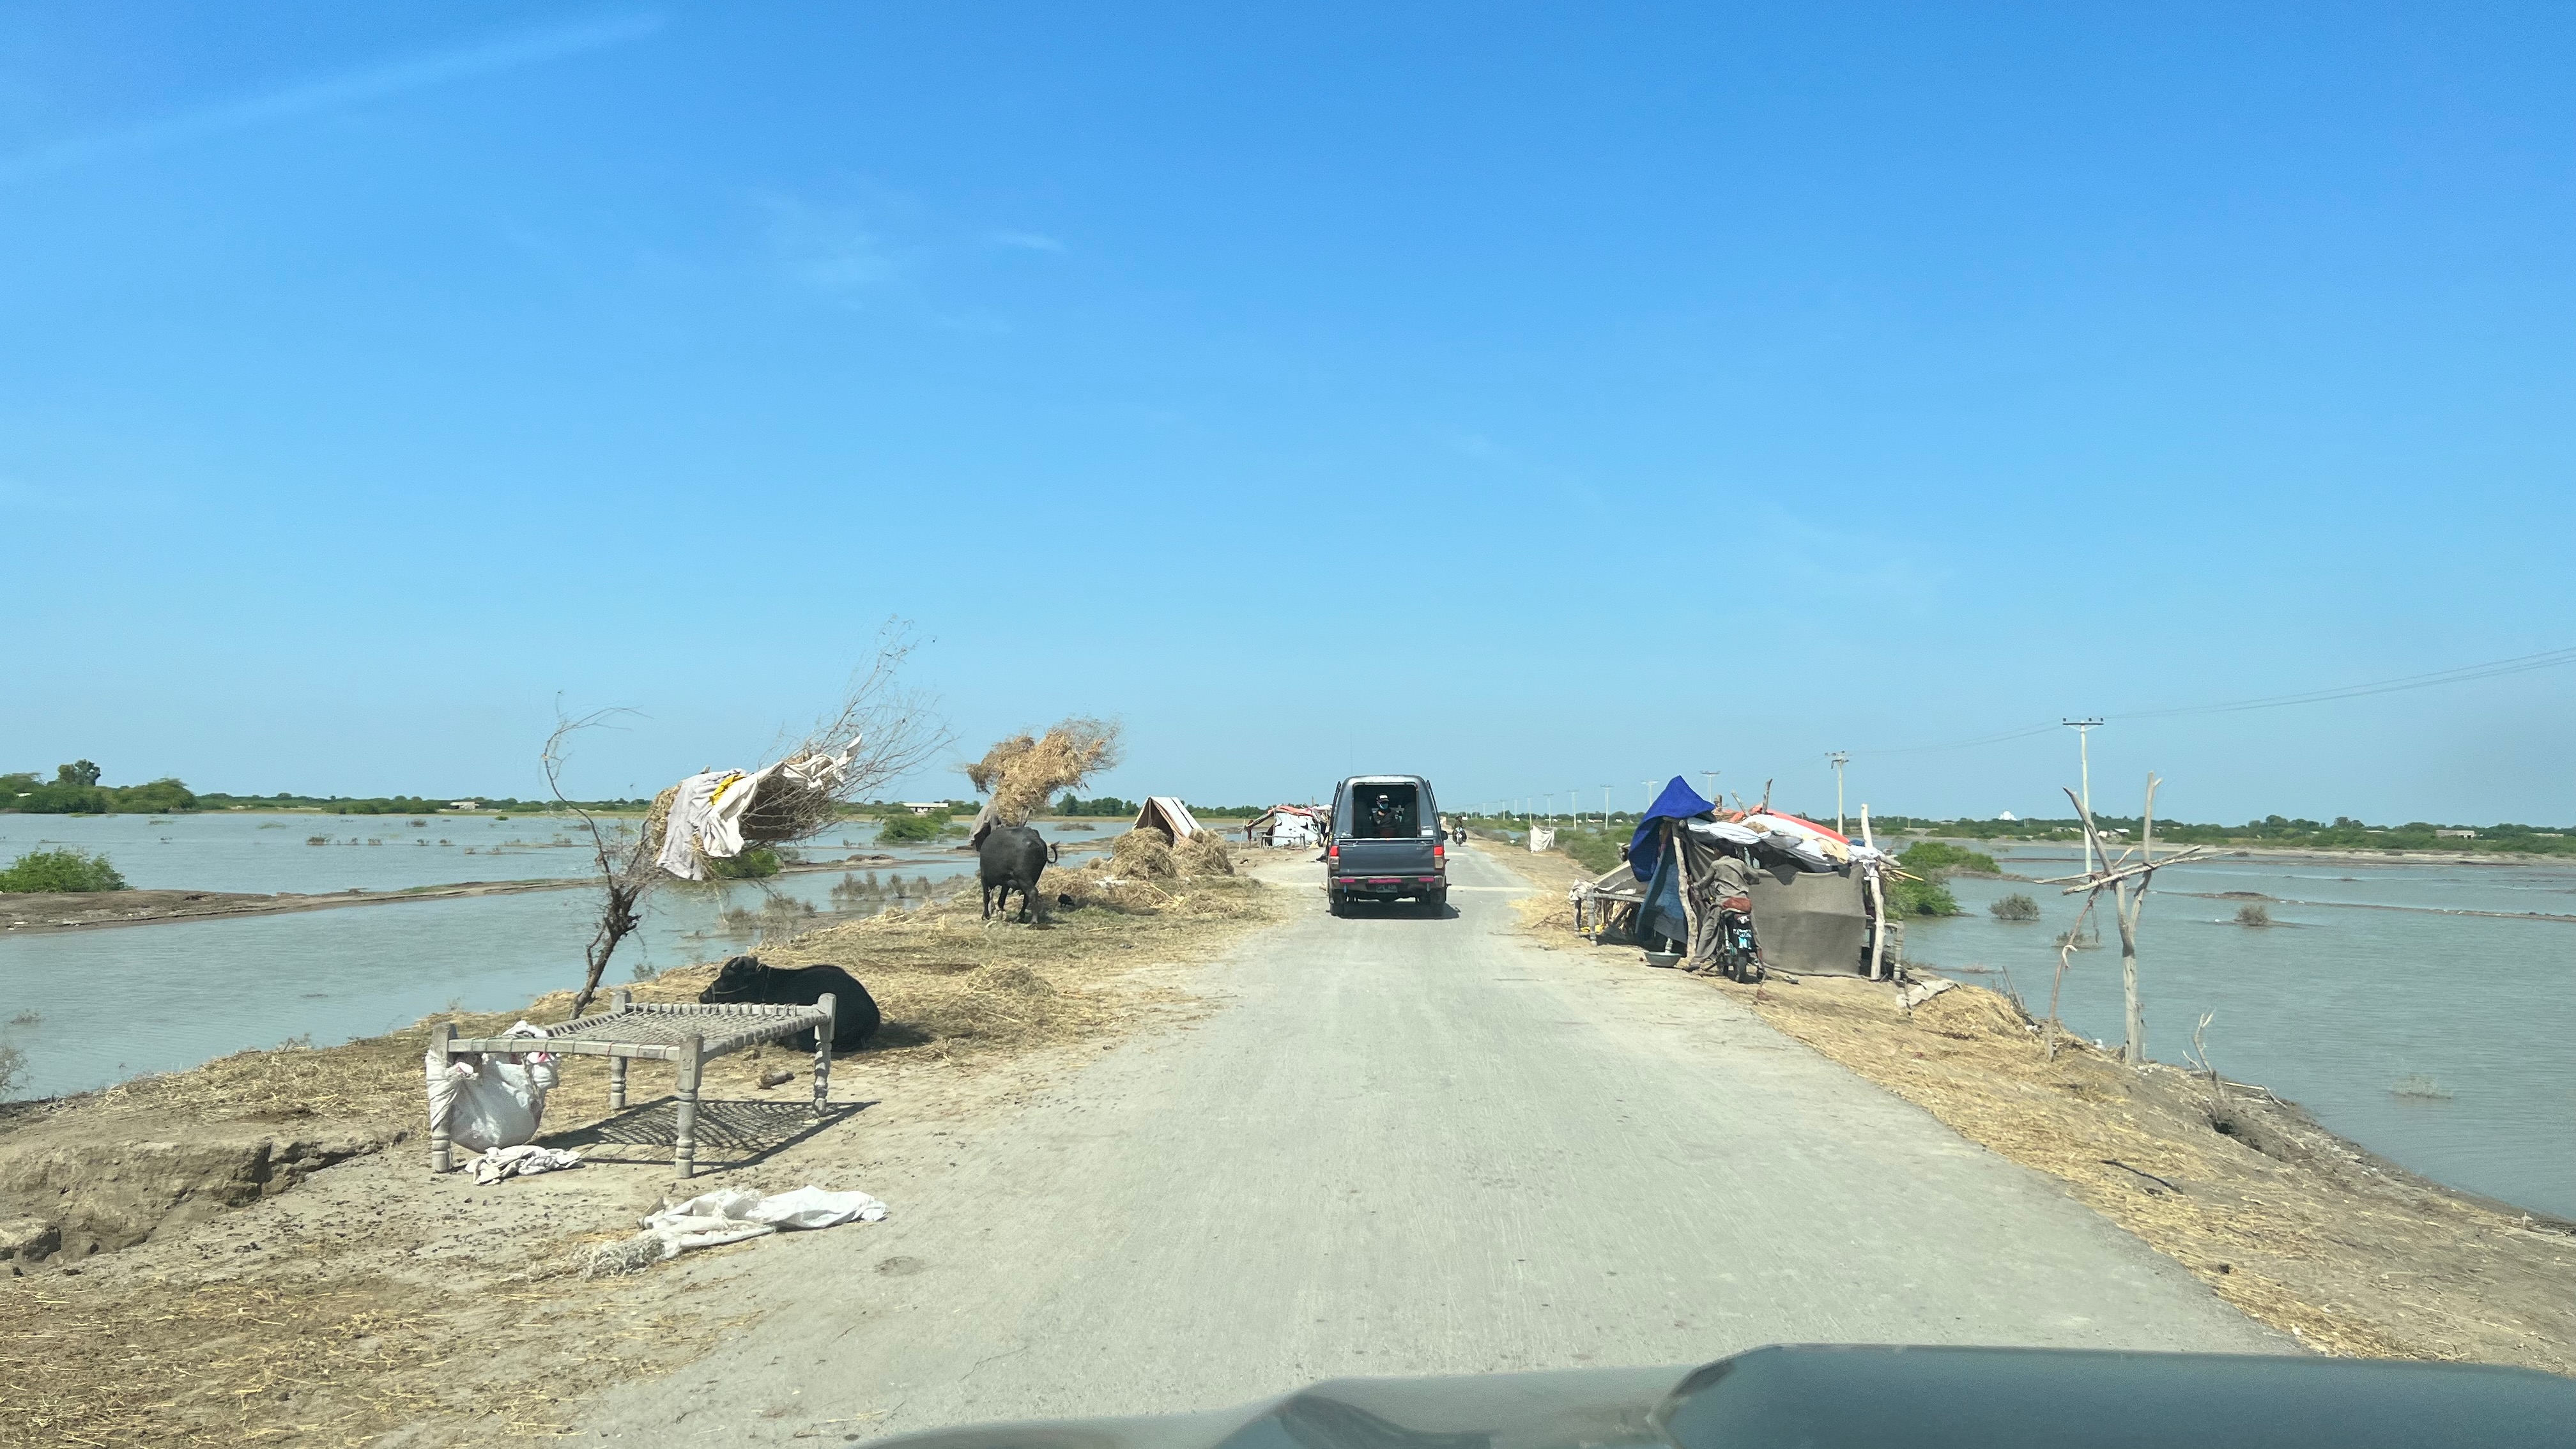 Example of roadside displacement near Mipur Khas, Sindh.
Note the movement of livestock with the displaced population.
Example of roadside displacement near Mipur Khas, Sindh.
Note the movement of livestock with the displaced population.
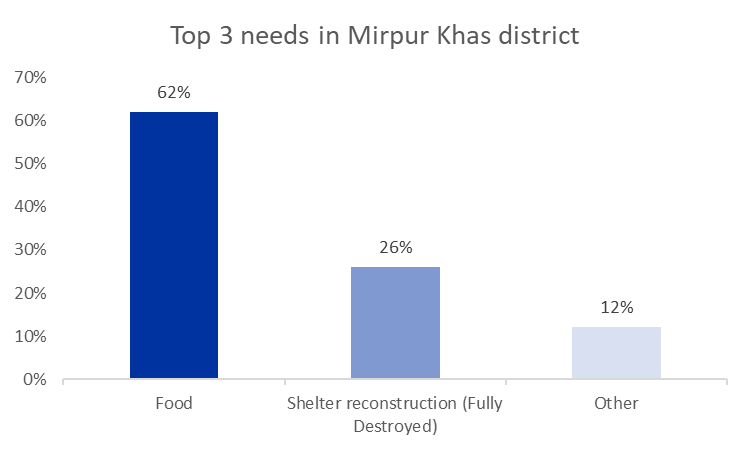
Based on DTM’s key informant’s estimates, the top three priority needs identified among temporarily displaced persons (TDPs) are food (62%), reconstruction of shelters for those whose homes were completely destroyed (26%), and a range of other critical needs reported by 12% of respondents which includes needs drinking water and other reasons. The findings highlight that is a need for an immediate, coordinated action by humanitarian actors and relevant authorities to mobilize resources and deliver targeted support.
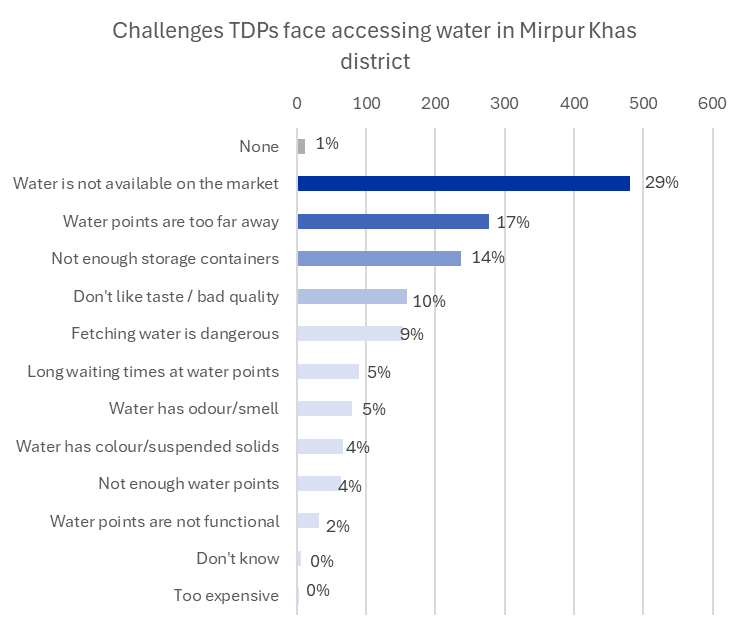
Access to safe and sufficient water has emerged as a critical challenge for flood-affected populations in Pakistan’s Mirpur District. According to key informant data, nearly one-third of respondents (29%) reported that water is not available on the market, while 17% cited the long distances to water points as a major barrier. Additional challenges include lack of storage containers (14%), poor water quality - indicated by bad taste (10%), odour (5%), and visible contamination (4%) and safety concerns while fetching water (9%).
These findings indicate a complex and urgent water crisis, where both availability and accessibility are compromised, putting affected communities at heightened risk of waterborne diseases and further displacement stress. Immediate multisectoral interventions are needed to restore functionality of water points, provide safe drinking water, and ensure equitable access, particularly for women and children who are often most affected by water collection burdens.
Food insecurity remains a pressing concern for temporarily displaced persons (TDPs) in Mirpur District, with coping mechanisms revealing both economic vulnerability and insufficient humanitarian coverage. Nearly half (45%) of affected households rely on purchasing food from local markets. Alarmingly, 21% reported resorting to selling assets to meet basic food needs. Only 12% benefit from formal food distribution, and 11% are borrowing to survive, indicating gaps in targeted assistance. The reliance on negative coping strategies such as asset depletion, borrowing, and bartering signals unsustainable strategies that could erode long-term resilience.